A brief guide to the air of Brussels
Résumé. La pollution de l’air reste un problème crucial de santé publique, mais aussi un problème environnemental, politique et socio-économique. La question n’est plus, aujourd’hui de savoir si l’air de Bruxelles est pollué, mais plutôt à quel point il l’est et quelles en sont les conséquences. Dans ce contexte, la discussion sur les impacts de la piétonnisation des boulevards centraux bruxellois ne pouvait éviter le sujet de la pollution et des reports de nuisances. Le présent article ambitionne de donner une image claire des enjeux majeurs liés à la pollution de l’air : ses causes principales, les effets d’une exposition à celle-ci sur la santé – notamment pour les personnes les plus vulnérables. Il donne un aperçu de la façon dont les pouvoirs publics belges et bruxellois abordent le problème (mesures de l’air, dispositions et instruments légaux, institutions), ainsi que les citoyens et la société civile. Il s’interroge sur les interventions localisées de diminution du trafic routier en rappelant que leur efficacité dépend largement de leur intégration dans des politiques globales de mobilité durable.
State of the art paper
En
Nicola da Schio, Bas de Geus & Catherine Bouland
VUB – Cosmopolis, VUB – MFYS & ULB – Ecole de Santé publique
Plan
Introduction
1. Hazard: the drivers of pollution
2. Vulnerability: the impact of air pollution
3. Coping with air pollution
4. Pedestrian areas and air quality
Conclusion
Biographie
Annex. Limit values for selected pollutants and the Brussels context
Introduction
Air pollution is a key public health, environmental, political and socio-economic problem issue. In Brussels, citizens, the press, researchers, decision makers and practitioners seem to be increasingly aware of the need to tackle air pollution: the question is not whether Brussels is polluted but how much it is polluted and what are the impacts of this pollution. In this context, the discussion on the range of impacts of the Pedestrianisation of Brussels central boulevards could not avoid pollution related questions [see also Keseru et al., 2016]: did pollution levels change? Was it displaced in neighbouring streets? What are its impacts on the exposure of residents and visitors? The response to these questions is by no means a simple one and requires extensive analysis over a long period of time. While two studies on the immediate impacts of the piétonnier on pollution, have been conducted by Brussels Environment [Beaujean et al., 2016; Heene et al., 2016], we also wish to contribute to a more informed discussion by introducing some of the key elements that are at stake when speaking of pollution. This paper, we hope, is not only useful to the discussion surrounding Brussels boulevards, but also to other collective reflections on forthcoming urban (mobility) projects, and more in general on the quality of urban life.
We shall start by the question: what is air pollution?
The glossary for Sustainable Cities of the United Nations Environment Programme (UNEP) defines air pollution as:
“…the presence of contaminant or pollutant substances in the air that do not disperse properly and that interfere with human health or welfare, or produce other harmful environmental effects” [UNEP, 2016]
This (and other) definition(s) of air pollution alludes to two important dimensions that structure the very nature of air pollution, namely the presence of specific compounds in the air we breathe (i.e. what we refer to as “hazard” , in section 2), and the negative impacts on people, on man-made structures and on the broader ecosystem (i.e. “vulnerability” , in section 3). Hazard and vulnerability are sometimes treated separately by researchers and policy-makers, and framed as an environmental and a health issue respectively. We join, however, the line of thinking that considers them as two sides of the same coin, and suggests to look at pollution and to tackle it in its entirety. After speaking of hazard and vulnerability, both in general and focusing on the Brussels Capital Region (BCR), we will introduce some existing strategies to cope with it, in terms of measurement and regulation (section 4), and will eventually question how the topic enters the discussion around traffic calming strategies and pedestrianisation (section 5). We’ll conclude with some reflections on the direction the discussion could (should) take. Considering the thematic focus of the BSI-Brussels Centre Observatory (BSI-BCO) that hosts this article, it will focus on issues of outdoor air pollution in cities.
1. Hazard: the drivers of pollution
In the Air Quality Guidelines, the World Health Organisation (WHO) indicates that ambient air pollution consists of a highly variable and complex cocktail of different substances, including several hundred different components potentially harmful to human health and the environment. Notwithstanding the variety of substances, research and governmental institutions often refer to a limited number of selected pollutants used to characterise air quality (i.e. criteria pollutants) [WHO, 2016].
As far as urban air pollution is concerned, the main relevant pollutants include:
- Particulate matter (PM) (also referred to as fine particles) is a catch-all term to refer to a complex mixture of solid and liquid particles of organic and inorganic substances suspended in the air. By nature, PM are composed of particles with different sizes, and include, among others, sulphate, nitrates, ammonium, sodium chloride, black carbon, mineral dust, to cite only a few. Among the most health-damaging particles are those with a diameter of 10 microns or less (i.e. PM10), 2.5 microns or less (i.e. PM2.5) and 0.1 microns or less (i.e. UFP), respectively. The smaller the particles, the more they can penetrate inside the body through the lungs or even for the smallest through the skin. Air quality measurements are typically given as mass concentrations, e.g. in micrograms per cubic meter (μg/m3).
- Nitrogen Oxides (NOx) are produced by reaction between nitrogen and oxygen, during all high temperature combustion processes, e.g. in vehicle engines, heating and power generation plants. NOx emissions typically take place in the form of Nitrogen Monoxide (NO), not particularly harmful for humans, and to a lesser extent Nitrogen Dioxide (NO2) (note that the proportion of NO2 in NOx has increased in recent diesel engines). The NO has a short lifetime in the atmosphere and, by reaction with oxygen, is rapidly transformed in NO2, which is more stable and harmful. This transformation occurs more rapidly when ozone concentrations are high.
- Sulphur dioxide (SO2) is a colourless gas with a sharp odour. It is produced from the burning of fossil fuels (e.g. coal and oil) and the smelting of mineral ores containing sulphur. The main anthropogenic source of SO2 is the burning of sulphur-containing fossil fuels for domestic heating, power generation and motor vehicles.
- Tropospheric ozone (O3) – which should not be confused with the ozone layer in the upper atmosphere – is one of the major constituents of photochemical smog. It is formed by the reaction with sunlight (hence the name photochemical reaction) of pollutants such as nitrogen oxides (NOx) and volatile organic compounds (VOCs) emitted by vehicles, solvents, domestic and industrial activities. As a result, the highest levels of ozone pollution occur during periods of sunny weather.
Sources: [Bruxelles Environnement, 2015a; WHO, 2016]
The level of concentration of these (and other) pollutants, and thus the quality of ambient air, results from complex interactions between natural and human environmental conditions: while the quantity of pollutants’ emissions is important, so is the case for their transport, transformation and dispersion in the atmosphere. And while it is not just an urban problem, air pollution is particularly prominent in urban settings, considering that cities concentrate different sources (e.g. transport, industries, space heating, …) and people whose health is impacted.
For policy-making, it is important to determine the sources of pollution, and to identify the sectors where action can be the most effective. Air pollution can be emitted from very different sources, with different spatial characteristics. From a practical point of view, industry (chimneys) is generally thought of as point sources, road traffic as line sources, farms as surface sources. After emission of the pollutant, its nature and the meteorological conditions will determine if it will stay close to its source or have a large spatial impact (e.g. PM10 tend to have a large spatial extent while NO stays close to its source due to its short lifetime in the atmosphere). Finally, generally speaking, in one specific point of space, air pollution can be seen as the sum of different contributions: at least the local contribution, due to close sources, and the non-local contribution, due to sources located far away. Various distinctions can then be made, depending on the scale and range of the contribution, from local to background concentrations. Another consideration concerns the relative contribution of various sectors: emissions can be of natural origins (e.g. volcanoes, forest fires, decay of organic matter), or anthropogenic (i.e. related to human activities). The latter are often more harmful, as their release may be more intensive and for prolonged periods of time, and because it often happens near or in regions with high population densities [Kennes & Veiga, 2001: 3].
Air pollution manifests itself differently in cities, in areas within cities, and across time as a consequence of different geographic, ecological, socio-economic, technological and political conditions. Concerning ambient air pollution in Brussels, we observe the following situation[1]:
- PM10 levels decreased significantly between 1990 and 2006, and is still decreasing up to this day. In 2012, building heating in the residential and tertiary sector’s, were the main local sources for PM10 with 55 % of direct emissions. Road transport was estimated to account for 42 % of emissions. It should be noted that there is a certain seasonal variation, where emissions from heating being (quite obviously) more relevant in winter. EU limit values for PM10 are not exceeded in Brussels since 2014.
- 5 levels, in turn, result from a combination of local (20 %), regional (35 %) and background pollution (45 %). Notwithstanding a significant reduction of PM2.5 levels, and the respect of the EU limit value since it was established in 2015, the current annual mean is still above the WHO recommendation (see table below). However, the European limit value for PM2.5 has not been exceeded since it entered into force in 2015.
- NOx emissions are mainly due to road transport (47 %) and building heating, while a significant proportion seems to be due to emissions taking place outside region (40 %). Notwithstanding a significant diminution of NO2 levels, this pollutant remains the main culprit of pollution in BCR. Brussels Environment estimates that the EU target values would be reached if the average emissions of NO2 throughout the year, would be like the emission of an average Sunday [Bruxelles Environnement, 2016a: 17].
- SO2 and O3 represent less of a problem in BCR, considering that the limit values have been respected since 1998 and 2003 respectively [Bruxelles Environnement, 2015a & 2016b].
The two graphs below (figures 1 and 2) illustrate the repartition among sectors of local emissions (i.e. emissions taking place within the BCR) [Bruxelles Environnement, 2015c]. While local emissions only contribute to a part of the total concentration of pollutants, they are the locus where local institutions are more likely to be in the conditions to act effectively. As it can be seen in both graphs, the road transport and residential sectors are responsible for the lion’s share of emissions within the BCR.
Figure 1. Repartition of PM10 emissions by source sector, based on data for Brussels Capital Region 2012
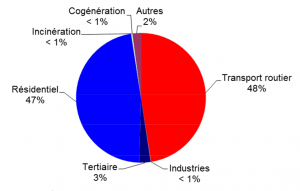
Source: [Bruxelles Environnement, 2015c]
Figure 2. Repartition of NOx emissions by source sector, based on data for Brussels Capital Region 2012
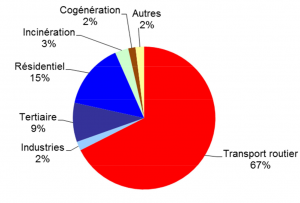
Source: [Bruxelles Environnement, 2015c]
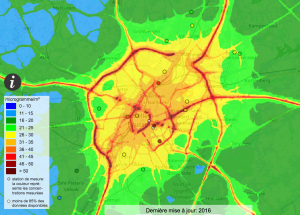
The maps below illustrate the spatial distribution of key pollutants in the BCR. The sharper colours along the main transport axes for all pollutants is indicative of the contribution of the transport sector (e.g. mainly the car) to regional pollution problems. Figure 3 shows the combination of the results of an air quality street canyon model (CANSBC) and the data collected by wearable devices in the context of the ExpAir project [see BRAL, 2016; Bruxelles Environnement, 2017]. The model input data include air quality and meteorological data from the regional telemetric network, topographic data from Urbis and traffic data from the MUSTI model. Figure 4 and figure 5, in turn where drawn by IRCELINE on the basis of an interpolation method coupled to an open street model. In these maps, the dots indicate the annual mean concentration levels of selected pollutants, as measured by the station of the regional telemetric network. The coloured layer is representative of modelled data (see www.irceline.be for more information). It should also be noted that the colour coding in the maps indicate absolute values of pollutants concentration and is not immediately indicative of what is ‘safe’ or ‘healthy’. These values need to be considered together with limits that are deemed to be acceptable, when they exist, according to predetermined criteria (see table in Annex 1). For black carbon, for instance, no limit value, target value or guideline exist yet.
Figure 3. Black Carbon mean concentration (averaging period: 2014-2016)
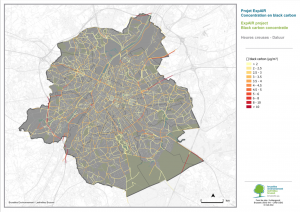
Source: [Bruxelles Environnement, 2017]
Figure 4. PM10 Annual mean concentration – 2016
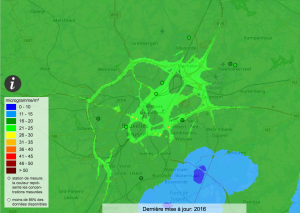
Source: irceline.be
Figure 5. NO2 Annual mean concentration – 2016
Source: irceline.be
The relations between emissions and the resulting pollutant concentrations are complex, and depend on the transport, and the physico-chemical transformations of pollutants (what’s called “chemistry-transport”). After emission, air pollutants are dispersed, diluted and subject to reactions, including photochemical reactions. Transport is affected by meteorological conditions (e.g. wind direction and speed, turbulence, atmospheric stability, air temperature, humidity, cloud cover), which have an impact on the dispersion of the pollutants, and on the formation of secondary aerosols. Winter smog episodes, for instance, are typically characterised by calm and stable weather conditions, whereas summer smog is characterised by hot, calm and sunny weather. A study by Brussels Environment, moreover, identifies relatively low humidity (<36 to 52 % RH) and relatively high humidity (92 to 100 % RH) as conditions particularly favourable to high PM10 concentration, as well as continental wind [Bruxelles Environnement, 2009]. The intensity and the direction of wind is particularly important, as wind can disperse local pollution, produce micro-effects such as wind vortexes in street canyons (see below), but also import it from other regions [irceline.be, n.d.].
The urban structure and topography (e.g. valleys, hills, trees, buildings,, …) are also important in determining pollutants dispersion. Particularly noteworthy is the so-called street canyon effect, whereby relatively narrow streets with high buildings imply a more difficult dispersion of pollutants. In Brussels, it was found that Black Carbon (BC) concentration levels are on average 2 or 3 times higher in “canyon” streets than in open streets. The relation between increased traffic and increased BC concentration is also different in the two types of street: while in an open street, an additional 1 000 vehicles per hour imply a BC increase of 0,5 μg/m3; in a street canyon the same traffic increase implies a BC increase of 2 μg/m3 [Bruxelles Environnement, 2017].
2. Vulnerability: the impact of air pollution
Air pollution has demonstrated impacts on several domains, including human health, but also on animals and vegetation (including agricultural productivity), on the quality of water and soil and on the ecosystem services that they support, on visibility and solar irradiation, on built infrastructure and cultural heritage, … (see for instance, [European Environment Agency, 2017a]. This article focuses on the impacts of air pollution on the health of European residents, particularly severe in urban areas, with high traffic density (Genc, Zadeoglulari, Fuss, & Genc, 2012). It also has considerable economic impact, cutting lives short, increasing medical costs and reducing productivity through working days lost across the economy. Europe’s most problematic pollutants in terms of harm to human health are particulate matter (PM), ground-level O3 and NO2 [European Environment Agency, 2017a].
In 2010, ambient PM pollution was ranked 9th among the leading risk factors for global disease burden [Lim et al., 2012] and is the single largest environmental health risk in Europe [European Environment Agency, 2015]. Estimates of the health impacts attributable to exposure to air pollution indicate that PM2.5 concentrations in 2012 were responsible for about 403 000 premature deaths originating from long-term exposure in Europe (EU28). In the same year, the estimated impact of exposure to NO2 (long-term exposure) and O3 (short-term exposure) concentrations on the population in the same 28 European countries was around 72 000 and 16 000 premature deaths, respectively. For Belgium (exposure in 2012), the average population-weighted concentration was 15.8 µg/m³ and 23.4 µg/m³ and resulted in 894 and 218 Years of Life Lost (YLL) per 105 inhabitants attributed to PM2.5 and NO2 exposure, respectively (European Environment Agency, 2015). Premature deaths attributable to PM2.5 and NO2 exposure in 2012 in Belgium was 9 300 and 2 300 respectively [European Environment Agency, 2015]. For BCR, the APHEKOM project concluded to a 7 months increase of the life expectancy for 30 years old inhabitants if the PM2.5 concentration was improved and reached the WHO guidelines (19 µg/m³ annual mean over the years 2004-2006 à 10 µg/m³) [Bouland, 2012; Pascal et al., 2013].
A 2013 assessment by the WHO’s International Agency for Research on Cancer (IARC) concluded that outdoor air pollution is carcinogenic to humans, with particulate matter (PM) closely associated with increased number of patients with cancer, especially lung cancer [WHO, 2016]. Heart disease and stroke are the most common reasons for premature death attributable to air pollution and are responsible for 80 % of cases of premature death; lung diseases and lung cancer follow [WHO, 2014]. Recently, air pollution exposure has been linked to adverse effects on the brain such as cognitive decline and neuropathology [Genc et al., 2012].
2.1. Air pollution and the impact on the most vulnerable
Most of the health impact studies reviewed by the WHO focuses on respiratory and cardiovascular effects attributed to exposure to air pollution. But evidence is also growing for a range of other effects, caused by exposure to air pollutants at different times of life, ranging from prenatal exposure all the way through childhood and adult life. For example, exposure to air pollutants during pregnancy has been associated with reduced foetal growth, pre-term birth and spontaneous abortions, and an increasing risk of the child developing allergies and asthma later in life.
Children’s exposure to air pollution is a special concern because their immune system, brain and lungs are not fully developed when exposure begins, raising the possibility of different responses than seen in adults. In addition, children spend more time outside, where the concentrations of pollution from traffic and other combustion sources are generally higher. Although air pollution has long been thought to exacerbate minor acute illnesses, recent studies have suggested that air pollution, particularly traffic-related pollution, is associated with infant mortality and the development of asthma and a predisposition toward developing certain allergic hypersensitivity reactions (i.e. atopy). Other studies have associated particulate air pollution with acute bronchitis in children and demonstrated that rates of bronchitis and chronic cough declined in areas where particle concentrations have fallen.
Susceptibility to adverse effects of air pollution is expected to differ widely between people and within the same person, over time. While some individuals may experience no symptoms or only clinically irrelevant changes, a similar exposure may trigger serious exacerbations of health problems among the elderly. Reduced lung function occurs as a natural part of aging and there is scientific evidence that elderly people are largely affected by the increased impairment resulting from exposure to air pollutants. Elderly people will most likely suffer from chronic diseases, and there is evidence that co-existing chronic lung, heart or circulatory conditions may worsen following exposure to environmental pollutants [Bateson & Schwartz, 2004].
2.2. Air pollution and different transport modes
Air monitoring studies (personal exposure) have shown that commuters are exposed to high (peak) concentrations of traffic related air pollution, much higher concentrations than those measured at fixed site monitors (back ground air pollution) because they are closer to the source. Time spent in traffic has been reported to be a significant predictor of 24 hour average personal exposure to air pollution [Strak et al., 2010]. A study conducted in Belgium by Dons and co-workers evaluated personal exposure of 62 individuals to the air pollutant Black Carbon (BC) during the whole day [Dons et al., 2011; Dons, Int Panis, Van Poppel, Theunis, & Wets, 2012] Activity logs made it possible to distinguish between in- and outdoor exposure and activities in different transport modes. Results showed that 6 % of the time is spent in transport, but it accounts for 21 % of personal exposure to BC and approximately 30 % of the inhaled dose. Concentrations in transport were 2-5 times higher compared to concentrations encountered at home. In this context, the question of the impact of the mode of transport on people’s personal exposure is crucial. The literature does not provide an unambiguous answer, also because the mode of transport can be related to other factors that influence significantly personal exposure, and cannot be fully accounted for –for instance- in a comparison among modes on the same route at the same time (e.g. choice of itinerary, route’s length in km and time, physical performance, meteorological conditions, infrastructure, urban form, …).
Overall, research shows that air pollution exposure in traffic depends on transport mode (e.g. active vs passive), choice of route (e.g. driving through a tunnel, cycling through a park or high-traffic street), and vehicle characteristics (old vs new car, diesel vs gasoline) [Zuurbier et al., 2010][Int Panis et al., 2010]. For example, Int Panis and colleagues compared particulate matter (PM) and particular number concentrations (PNC) exposure (particles surrounding the subject) of cyclists and car passengers commuting at nearly the same time of the day on the same road. They found that although mean bicycle/car ratios for PM and PNC are close to 1 (meaning that the air pollution surrounding the commuter was almost equal), inhaled dose (PM and PNC x ventilation rate) and lung deposited doses are significantly higher in cyclists. The reason is that ventilation rate (breathing rate) was on average 4.3 times higher during cycling compared to car driving [Int Panis et al., 2010]. This type of results was confirmed in a systematic review by Cepeda and colleagues [Cepeda et al., 2016]. They showed that car commuters had higher exposure to all pollutants (fine particles, coarse particles, CO, BC, NO2) than did active commuters in 71 % comparisons, followed by those who commuted by bus in 52 %, by motorcycle in 50 %, and by a car with controlled ventilation settings in 45%. Overall, active commuters had higher inhalation doses (air pollutants x ventilation rate) than did commuters using motorised transport (median ratio car with controlled ventilation settings 0.16 [0.10–0.28]; car 0.22 [0.15–0.30]; motorcycle 0.38 [0.26–0.78]; bus 0.72 [IQR 0.50–0.99]).
Although cycling for transportation may benefit health because it holds the potential of being more physically active on a regular basis [De Geus, Joncheere, & Meeusen, 2009; De Geus, Van Hoof, Aerts, & Meeusen, 2008; Mueller et al., 2015], a high inhalation exposure to traffic-related air pollution might impose a risk towards adverse health effects [Mueller et al., 2015]. Exercise in polluted air may lead to acute cardiopulmonary effects, e.g. decreased lung function, increased levels of inflammatory markers and altered immune function in the pulmonary system [Cutrufello, Smoliga, & Rundell, 2012; Jacobs et al., 2010]. Long term exercise may lead to diminished lung function and incidence of asthma [Cutrufello et al., 2012]. Jacobs [Jacobs et al., 2010] and Bos [Bos et al., 2011] showed that 20 min of cycling along a busy traffic road acutely increased the fraction of blood neutrophils (a marker of systemic inflammation) and attenuated the exercise-induced increase of Brain Derived Neurotrophic Factor (BDNF) in contrast to cycling indoors in a room without air pollution. As mentioned before, particular attention should be put on children and older adults cycling in busy streets.
3. Coping with air pollution
If in the section above we illustrated the sources and the impacts of urban air pollution, we introduce now strategies to cope with the problem, i.e. the methods to measure pollution, and the framework of regulations and institutions that focus on mitigating it. In both circumstances, a distinction is made between the level of emissions (i.e. measuring and limiting the amount of pollutants that is emitted in the atmosphere), and of concentration (i.e. measuring and limiting the concentration of pollutants that is present in the atmosphere at a given time, also referred to as immission).
Today there is a wealth of different techniques to measure air pollution, and the debate on which one is the most adequate should not only focus on the technical performance, but also the questions and societal priorities that the various approaches can help addressing. These considerations are particularly relevant in Brussels, where the regional monitoring system has recently been questioned both from by the European Commission (dossier d’infraction n°2016/2005) and by the NGO ClientEarth that, together with five Brussels residents, has taken the regional government to court on that matter.
Concretely, emissions are estimated through mathematical models, that combine the number of emission sources (e.g. mobile such as vehicles, and fixed such as heating plants), and their emission factor (e.g. the average amount of pollutant, per unit of burned fuel). In the Brussels context, these estimations are conducted regularly and published as part of emission inventories [Bruxelles Environnement, 2015c]. There is, however, considerable uncertainty regarding the models used to estimate emissions, with measurements in real-world conditions providing different results than laboratory tests. Over the last 20 years, for instance, it was discovered that NOx emissions from diesel engines have changed significantly less than what could be presumed under the stricter standards [Bruxelles Environnement, 2016a; European Environment Agency, 2017b].
As far as concentration is concerned, the most common and widely acknowledged system to measure ambient air pollution makes use of fixed measuring stations that collect routinely data on selected pollutants. In the BCR, a network of 13 monitoring stations located throughout the region provides data on various “typical” situations, characterised by different levels of traffic intensity and population density, urban topography, land-use (see [Bruxelles Environnement, 2015b] for a detailed illustration of the monitoring system). This data, in turn, is combined with the emissions inventories and with information on meteorological and topographic conditions influencing pollution levels, and is used to cartography pollution over a certain region. Measured and modelled data is used for real-time institutional reporting (irceline.be, n.d.; qualitedelair.brussels, n.d.)), but also for projects conducted by universities and research institutes (see, among others, http://www.atmosys.eu), and by private online platforms and apps that provide alternative air quality indexes (e.g. see aqicn.org/city/brussels/; air.plumelabs.com/fr/live/bruxelles). Since April 2017 a rather unique project of data-journalism by the ULB researcher Laurence Dierickx and the magazine Alter Echo collects, analyses and publishes in real-time Brussels pollution data (http://www.bxlairbot.be) .
The system of fixed stations has undoubtedly the merit of providing standardised data on ambient air pollution, with a virtually all-embracing spatial and temporal coverage. It presents, nevertheless, two fundamental limitations. First, the limited number of stations and the limitations of the models imply a certain degree of inaccuracy. Second, this method does not reflect actual exposures experienced by individuals, which results from the combination of how pollution is distributed and from their own daily routines [Sivaraman, Carrapetta, Hu & Luxan, 2013]. Different solutions exist to address these limitations. These include using other measuring tools, such as wearable devices; and/or engaging citizens in the data collection through crowd-sensing and citizen science campaigns. (the expAIR project, conducted by Brussels Environment and BRAL, is an example of such alternative monitoring strategies [Bruxelles Environnement, 2013]. These approaches cannot (nor aim to) replace the network of fixed stations because of a number of technological and methodological limitations. At the same time, they do provide policy-relevant knowledge, as well as important opportunities to engage citizens and communities to pursue effectively scientific and societal ambitions. For an account of the potential and limits of participatory air quality monitoring see [Dons et al., 2017; Theunis, Peters, & Elen, 2016]; or AirCasting Brussels & Smarter Labs Project for details of an ongoing citizen science project focusing on Brussels air pollution (see www.cosmopolis.be/research/aircastingbxl).
Air pollution is also the subject of an intense normative activity at different institutional levels, which are all relevant for the governance of air in Brussels. At European Union level, different bodies of legislations address different targets. Where ambient air quality is concerned (i.e. concentration), the key legislative reference today is the EU Directive 2008/50/EC on ambient air quality and cleaner air for Europe Ambient air quality Directive – AAQD). Among other things, the AAQD which lays down measures for establishing and realising limits and target values, assessing air quality and provide transparent information things (more info: ec.europa.eu/environment/air/quality/). As far as action on sources is concerned, emission regulations are adopted as part of the EU framework for the type approval of cars, vans trucks, buses and coaches. In the BCR, air quality policies are governed by the 2013 Brussels Code for Air, Climate and Energy Management (COBRACE). The Regional Plan for Air, Climate and Energy (PRACE) of 2016, in turn, provides the priority axes to reduce energy consumption and GHG emissions, and to improve air quality. Finally, the elaboration of a Regional Plan for Sustainable Development (PRDD) is currently in progress. The draft plan indicates the main areas of intervention to improve air quality, namely the transportation and the building sector, in the context of regional development toward a 2025 and 2040 horizon.
Various policies and regulations in different domains directly or indirectly impact the quality of Brussels air (e.g. ranging from the environmental impact assessment regulation to parking policies…). Two policies deserve to be mentioned here, though, because of their specific focus on air quality, namely the Pollution Peak Emergency Plan (PPEP), and the Low Emission Zone (LEZ). The first focuses on winter pollution peaks events: whenever a certain threshold is reached, the Plan provides for the automatic adoption of a series of measures, including information sharing, speed limits for motorised transport, temperature limits for building heating, alternate circulation… (see www.qualitedelair.brussels). The latter, which will enter into force on the 1st of January 2018, consists in limiting progressively the access to the region to vehicles that do not respect certain emissions standards (see http://lez.brussels/). While these efforts need to be acknowledged, neither the PPEP nor the LEZ seem to have the ambition that is needed to deal with Brussels pollution problems. The PPEP, on one hand, only covers a limited set of pollutants (i.e. PM10 and NO2), and was explicitly designed to be triggered only in extremely rare circumstances [Brussels Capital Region, 2008]. As for LEZ, on the other, the presence of numerous exceptions to the limits, the problems with the environmental standards that we mentioned above, the limited enforcement and control, and the mixed experience of other cities and countries [see for instance Holman, Harrison, & Querol, 2015], make us dubitative on its real potential to address the culprits of the issue. The current government seems to have the intention to improve the PPEP, and the definition of the LEZ appears to be (at least partially) work-in-progress, which is why a definitive assessment of these two policies will only be possible after conducting post-hoc evaluation, corroborated by extensive data.
As for the institutional framework, ambient air quality is part of the regional competence [Constitution, Art.23]. The exercise of the competence on the environment, in due respect of the COBRACE, is devoted to the Minister in charge of Housing, Quality of Life, Environment and Energy, currently Céline Frémault (CdH). Administrative competences fall under the responsibility of Brussels Environment – BE. The Belgian Interregional Environment Agency (IRCEL-CELINE), finally, is responsible to organise and disseminate data on air quality collected by the regional telemetric networks, and regularly publishes the results of the regional air quality measurements. The federal authority also plays a decisive role, even if only by way of exception, as it has the competence on product standards, including the rules for authorising vehicles.
In addition to “institutional” actors, the Brussels civil society has been historically very dynamic, and while activism on air quality and pollution is not new, in the last years the topic has received particular attention from many different perspectives (e.g. environment, public health, mobility…). Clean Air Brussels was organised as a platform in the context the public consultation of the PRACE in 2015 and continues since to work in raising citizens’ awareness. BRAL is very active with advocacy for cleaner air, participatory measurements of air quality and awareness raising. Bruxsel’air is a citizen movement working to advocate for more ambitious action by the government, e.g. through citizens’ discussions, citywide demonstrative actions, public events and other campaigns. Five Brussels residents, supported by the NGO ClientEarth have taken legal action against the Brussels government for failing to deal with illegal levels of air pollution and to monitor air pollution effectively. Brussels-based researchers from different academic disciplines, moreover meet regularly, share expertize, and discuss their role in improving urban air. Various other projects, finally, are bringing together universities and citizens to experiment with alternative approaches of knowledge production and development of effective solutions.
4. Pedestrian areas and air quality
The silver bullet that will fully solve all problems related to urban air pollution is yet to be found. Nevertheless, there have been and there are numerous examples where successful measures were taken to decrease air pollution: traffic calming measures and reallocations of road capacity are among them. These examples are not always “pedestrianizations” as such, but are measures to reduce the number of cars in one street (reduction in road capacity), a small or large area.
Studies from other European cities clearly show that traffic-calming measures were effective in decreasing the number of cars, decrease air pollution and as a consequence increase health. The London Congestion Charging Scheme (CCS) resulted in an appreciable decrease in annual average daily traffic for cars (26 %) and heavy goods vehicles (7 %) between the pre- and post-CCS periods within the charging zone. This decrease in motorised traffic resulted in a decrease (pre-post difference) in NO2 (-0.73 µg/m³) and PM10 (-0.24 µg/m³) and as consequent predicted 183 and 63 Years of Life Gained (YLG) per 100 000 people. The study of Cesaroni et al evaluated the impact, in terms of air quality and health effects, of two low-emission zones established in Rome in the period 2001-2005 [Cesaroni et al., 2012]. As a result of the policy, 264 522 residents living along busy roads gained 3.4 days per person (921 YLG per 100 000 persons) for NO2 reduction. Car-free days are another interesting example of a “natural experiment” during which the effect on air quality of a decrease in the number of cars can be measured. During the Car-free Sunday of 2005 in Brussels, the mean NOx concentrations, measured in the Rue de la Loi (Brussels) were 10 times lower compared to an average weekday and 5 times lower compared to an average Sunday [Bruxelles Environnement, 2014].
Different measurements have also been carried out to measure pollution levels in and around the Brussels piétonnier, before and after closing the central boulevards for motorised traffic: the preliminary reports show that the implementation of the piétonnier has resulted into a significant reduction of black carbon concentration in the area, ranging between 35 % and 55 %. It should be noted that the piétonnier reduced significantly the local contribution to BC, on average around 56 % and 79 % during the peak hours, but had virtually no impact on the background contribution (Beaujean et al., 2016). In the neighbouring areas, on the contrary, an increase in the local contribution to BC concentration was recorded, with pollution hotspots such as on the Boulevard de l’Empereur (plus 134 %) and the area of the Marché au Bois (plus and 128 %) [Bruxelles Environnement, n.d.].
As it can be concluded from the examples above, a traffic-free public space has the direct impact of decreasing exposure of those who “use” it, by travelling through it, working in the area, and in general spending time within it. Also for those living inside the piétonnier a substantial health effect can be expected as the concentration of air pollution inside the home is partly influenced by the outdoor air pollution. The same pedestrianisation could also have a wider effect (outside the pedestrianisation area): it has been observed, in fact, that when road capacity or cars accessibility are reduced in congested urban areas, traffic will not only relocate to other routes or seek to travel at different times, but significant proportions of it will disappear from the road network [AECOM, 2013]. In line with this considerations, Cairns and colleagues’ review report concludes that the balance of evidence is that measures which reduce or reallocate road capacity – when well-designed and favoured by strong reasons of policy – should not automatically be rejected for fear that they will inevitably cause unacceptable congestion [Cairns, Hass-Klau & Goodwin, 1998].
Can we thus expect that extending the Brussels piétonnier contributes in mitigating the pollution problems within the pedestrian area and across the BCR? For Brussels, the answer, we believe is far from being unambiguous. The broader impact of a piétonnier on pollution, however, depends on whether this is part of a broader strategy toward cleaner transportation and mobility. On one hand, if the piétonnier remains a car-free island in a car oriented city, the traffic and the related pollution might simply be moved to neighbouring streets (as it was partially observed), with no net impact on the city and on its residents, or even with a negative impact if the traffic is redirected toward narrower street where pollutants dispersion is more difficult. In that case residents and passers-by only benefit from a cleaner air at the expenses of other people’s health and quality of life. On the other hand, the piétonnier and other (semi)pedestrianisation schemes throughout the city can be a valuable opportunity to redefine practically and symbolically the place of pedestrians in the city. This will only happen if the design of a car-free street is just a part of a plan to renovate a neighbourhood, and is backed by effective strategies to avoid the report of traffic in the neighbouring areas and to ensure that the area becomes accessible through cleaner options.
Conclusion
This article has introduced some of the main issues that are at stake when speaking of urban air pollution. We illustrated the factors that pollutants’ concentration, and the impacts of pollution on human health. We also introduced some of the approaches that are used to measure the different dimensions of air pollution, the governance settings in the BCR, and the implications of pedestrian areas in relation to pollution levels and people vulnerability.
To address the problem of air pollution, we believe, a number of areas deserve particular attention. Urban residents, on one hand, can play a role in cutting emissions by adopting an eco-responsible behaviour (e.g. choosing non-motorised mobility, moderating space heating, …) and by reducing their own vulnerability, whenever possible (e.g. avoiding highly polluted streets, street canyons, …). At the same time, behavioural change (whether this starts from people, or is supported by the government through incentives and information) is just a part of the solution: pollution is an unwanted consequence of urban common living and, as such, should primarily be tackled as a collective question. The institutional and policy linkages, between health and environmental domain, but also with mobility and spatial planning, could be strengthened to combine the resources and the expertise that exists across departments. Innovative measurement approaches should be used to complement the current network of ambient air quality monitoring, and generate policy-relevant knowledge. Ambitious actions should be taken, finally, to re-design the urban space and infrastructures to facilitate the transition toward a less polluted city. The Brussels piétonnier, in this context, can play a role, but only if it is part of a broader strategy to re-think spatial planning and transportation in our city.
Finally, we shall emphasise that the discussion around air pollution should go beyond its technical and scientific aspects. As Whitehead notes “to become pollution, contaminates have to work with the pressure dynamics, weather patterns, thermodynamic systems and chemical exchange functions of the atmosphere, and produce culturally, biologically and politically unacceptable/intolerable air conditions” [Whitehead, 2009]. In other words, defining pollution is both a descriptive and a normative exercise: it includes the scientific observation of how certain compounds happen to be present in the urban air and interact with the people and with the ecosystem. At the same time, it entails a decision on what margins are acceptable or not in a given context. This decision, albeit supported by broad awareness of the science of pollution, should result from a collective reflection on how much is “too much”, and on the vision of a city that citizens want to realise.
Bibliography
AECOM, 2013. A Review of Weekend Closures on Chesterfield Avenue in the Phoenix Park, 2012. Dublin, Ireland.: T.O.o.P. Works, Editor. Available on: http://ds2.opw.ie/wp-content/uploads/2017/08/Chesterfield-Av-closure-report.pdf
Bateson, T. F. & Schartz, J., 2004. Who is sensitive to the effects of particulate air pollution on mortality? A case-crossover analysis of effect modifiers. In: Epidemiology (Cambridge, Mass.), vol.15, no. 2, 143–149.
Beaujean, F., Declerck, P., de Vos, T., Heene, B., Mendes, G., & Brasseur, O. (2016). Evaluation de l’impact de la nouvelle zone piétonnière dans le centre de bruxelles sur la qualité de l’air. Brussels Environment. Retrieved from http://bral.brussels/sites/default/files/bijlagen/BIM_Brasseur_Rapport_phase1et2_Pi%C3%A9tonnier_Anspach.pdf
Bos, I., Jacobs, L., Nawrot, T. S., de Geus, B., Torfs, R., Int Panis, L., … Meeusen, R. (2011). No exercise-induced increase in serum BDNF after cycling near a major traffic road. Neuroscience Letters, 500(2), 129–132. https://doi.org/10.1016/j.neulet.2011.06.019
Bouland, C. (2012). APHEKOM, local city report: Brussels. Retrieved from http://aphekom.org/c/document_library/get_file?uuid=a86d19b5-8946-4b2d-9d7c-9729dd2770bc&groupId=10347
BRAL. (2016, September 21). Projet Expair: Citizens Demand Clean Air. Retrieved February 1, 2017, from http://bral.brussels/fr/artikel/projet-expair-citizens-demand-clean-air
Brussels Capital Region. Arrêté du Gouvernement de la Région de Bruxelles-Capitale déterminant les mesures d’urgence en vue de prévenir les pics de pollution atmosphérique par les micro- particules et les dioxydes d’azote (2008). Retrieved from http://www.environnement.brussels/sites/default/files/user_files/20081127_agb_pic_pollution.pdf
Bruxelles Environnement. (undated). Comparaison : Impact du piétonnier dans le centre-ville de Bruxelles sur la contribution locale aux concentrations de Black Carbon. Retrieved from http://bral.brussels/sites/default/files/bijlagen/Rapport%20LB_Comparaison_avant_apres_pietonnier.pdf
Bruxelles Environnement. (2009). 23. Les particules fines (PM10, PM2,5). Retrieved from http://document.environnement.brussels/opac_css/index.php?lvl=notice_display&id=7365
Bruxelles Environnement. (2013). Brochure expAIR. Retrieved February 1, 2017, from http://document.environnement.brussels/opac_css/elecfile/DEP%20Expair%20FR
Bruxelles Environnement. (2014, July 7). Welke invloed heeft het verkeer op de luchtkwaliteit? [Text]. Retrieved September 8, 2017, from http://www.leefmilieu.brussels/themas/lucht-klimaat/luchtkwaliteit/welke-invloed-heeft-het-verkeer-op-de-luchtkwaliteit
Bruxelles Environnement. (2015a). 02. Pollution atmosphérique en RBC: constats. Retrieved from http://document.environnement.brussels/opac_css/index.php?lvl=notice_display&id=7361
Bruxelles Environnement. (2015b). 05. Les accords internationaux et leurs implications en matière de fourniture de données : les polluants suivis en Région de Bruxelles-Capitale. Retrieved from http://document.environnement.brussels/opac_css/index.php?lvl=notice_display&id=8888
Bruxelles Environnement. (2015c). 43. Synthèse des émissions de polluants atmosphériques en Région de Bruxelles-Capitale. Retrieved from http://document.environnement.brussels/opac_css/index.php?lvl=notice_display&id=8419
Bruxelles Environnement. (2016a). 08. Oxydes d’azote (NOx). Retrieved from http://document.environnement.brussels/opac_css/index.php?lvl=notice_display&id=7402
Bruxelles Environnement. (2016b, September 21). Etat de l’environnement – Rapport 2011-2014 [Text]. Retrieved July 3, 2017, from http://www.environnement.brussels/tmp-etat-de-lenvironnement/air
Bruxelles Environnement. (2017). Cartographie du black carbon en Région bruxelloise. Bruxelles Environnement IBGE – Division Labo, santé et indicateurs. Retrieved from http://www.environnement.brussels/news/la-pollution-au-black-carbon-touche-differemment-les-bruxellois-selon-le-mode-de-transport-et
Cairns, S., Hass-Klau, C., & Goodwin, P. B. (1998). Traffic impact of highway capacity reductions: assessment of the evidence. London: Landor Publishing. Retrieved from http://discovery.ucl.ac.uk/33442/
Cepeda, M., Schoufour, J., Freak-Poli, R., Koolhaas, C. M., Dhana, K., Bramer, W. M., & Franco, O. H. (2016). Levels of ambient air pollution according to mode of transport: a systematic review. The Lancet Public Health, 0(0). https://doi.org/10.1016/S2468-2667(16)30021-4
Cesaroni, G., Boogaard, H., Jonkers, S., Porta, D., Badaloni, C., Cattani, G., … Hoek, G. (2012). Health benefits of traffic-related air pollution reduction in different socioeconomic groups: the effect of low-emission zoning in Rome. Occupational and Environmental Medicine, 69(2), 133–139. https://doi.org/10.1136/oem.2010.063750
Cutrufello, P. T., Smoliga, J. M., & Rundell, K. W. (2012). Small things make a big difference: particulate matter and exercise. Sports Medicine (Auckland, N.Z.), 42(12), 1041–1058. https://doi.org/10.2165/11635170-000000000-00000
De Geus, B., Joncheere, J., & Meeusen, R. (2009). Commuter cycling: effect on physical performance in untrained men and women in Flanders: minimum dose to improve indexes of fitness. Scandinavian Journal of Medicine & Science in Sports, 19(2), 179–187. https://doi.org/10.1111/j.1600-0838.2008.00776.x
De Geus, B., Van Hoof, E., Aerts, I., & Meeusen, R. (2008). Cycling to work: influence on indexes of health in untrained men and women in Flanders. Coronary heart disease and quality of life. Scandinavian Journal of Medicine & Science in Sports, 18(4), 498–510. https://doi.org/10.1111/j.1600-0838.2007.00729.x
Dons, E., Int Panis, L., Van Poppel, M., Theunis, J., & Wets, G. (2012). Personal exposure to Black Carbon in transport microenvironments. Atmospheric Environment, 55, 392–398. https://doi.org/10.1016/j.atmosenv.2012.03.020
Dons, E., Int Panis, L., Van Poppel, M., Theunis, J., Willems, H., Torfs, R., & Wets, G. (2011). Impact of time–activity patterns on personal exposure to black carbon. Atmospheric Environment, 45(21), 3594–3602. https://doi.org/10.1016/j.atmosenv.2011.03.064
Dons, E., Laeremans, M., Orjuela, J. P., Avila-Palencia, I., Carrasco-Turigas, G., Cole-Hunter, T., … Int Panis, L. (2017). Wearable sensors for personal monitoring and estimation of inhaled traffic-related air pollution: evaluation of methods. Environmental Science & Technology. https://doi.org/10.1021/acs.est.6b05782
European Environment Agency. (2015). Air quality in Europe: 2015 report. Luxembourg: European Environment Agency. Retrieved from http://bookshop.europa.eu/uri?target=EUB:NOTICE:THAL15005:EN:HTML
European Environment Agency. (2017a). Air quality in Europe: 2017 report (Publication). Retrieved from https://www.eea.europa.eu/publications/air-quality-in-europe-2017
European Environment Agency. (2017b, January 27). Comparison of NOx emission standards for different Euro classes [Infographic]. Retrieved October 17, 2017, from https://www.eea.europa.eu/media/infographics/comparison-of-nox-emission-standards
European Parliament, & European Council. Directive 2008/50/ec of the european parliament and of the council of 21 may 2008 on ambient air quality and cleaner air for europe, Pub. L. No. 2008/50/ec (2008). Retrieved from http://eur-lex.europa.eu/legal-content/EN/TXT/PDF/?uri=CELEX:32008L0050&from=en
Genc, S., Zadeoglulari, Z., Fuss, S. H., & Genc, K. (2012). The adverse effects of air pollution on the nervous system. Journal of Toxicology, 2012, 782462. https://doi.org/10.1155/2012/782462
Heene, B., Beaujean, F., Declerck, P., de Vos, T., Mendes, G., & Brasseur, O. (2016). Evaluation de la qualité de l’air dans le pentagone de la Région de Bruxelles-Capitale. Brussels Environment. Retrieved from http://bral.brussels/sites/default/files/bijlagen/BIM_Brasseur_Evaluation_QA_Pentagone_Rapport_BRAL_ExpAIR_03032016.pdf
Holman, C., Harrison, R., & Querol, X. (2015). Review of the efficacy of low emission zones to improve urban air quality in European cities. Atmospheric Environment, 111, 161–169. https://doi.org/10.1016/j.atmosenv.2015.04.009
Int Panis, L., de Geus, B., Vandenbulcke, G., Willems, H., Degraeuwe, B., Bleux, N., … Meeusen, R. (2010). Exposure to particulate matter in traffic: A comparison of cyclists and car passengers. Atmospheric Environment, 44(19), 2263–2270. https://doi.org/10.1016/j.atmosenv.2010.04.028
irceline.be. (n.d.). Belgian Interregional Environment Agency (IRCEL – CELINE) — English. Retrieved February 7, 2017, from http://www.irceline.be/en
Jacobs, L., Nawrot, T. S., de Geus, B., Meeusen, R., Degraeuwe, B., Bernard, A., … Panis, L. I. (2010). Subclinical responses in healthy cyclists briefly exposed to traffic-related air pollution: an intervention study. Environmental Health, 9, 64. https://doi.org/10.1186/1476-069X-9-64
Kennes, C., & Veiga, M. C. (2001). Fundamentals of Air Pollution. In C. Kennes & M. C. Veiga (Eds.), Bioreactors for Waste Gas Treatment (Vol. 4, pp. 3–15). Springer Netherlands. https://doi.org/10.1007/978-94-017-0930-9_1
Keseru, I., Wuytens, N., de Geus, B., Macharis, C., Hubert, M., Ermans, T., & Brandeleer, C. (2016). Monitoring the impact of pedestianisation on mobility and sustainability. BSI-BCO Portfolio, #1. Retrieved from https://bsi-bco.brussels/wp-content/uploads/2016/12/BSI-BCO-P1-Keseru-etal.pdf
Lim, S. S., Vos, T., Flaxman, A. D., Danaei, G., Shibuya, K., Adair-Rohani, H., … Ezzati, M. (2012). A comparative risk assessment of burden of disease and injury attributable to 67 risk factors and risk factor clusters in 21 regions, 1990–2010: a systematic analysis for the Global Burden of Disease Study 2010. The Lancet, 380(9859), 2224–2260. https://doi.org/10.1016/S0140-6736(12)61766-8
Mueller, N., Rojas-Rueda, D., Cole-Hunter, T., de Nazelle, A., Dons, E., Gerike, R., … Nieuwenhuijsen, M. (2015). Health impact assessment of active transportation: A systematic review. Preventive Medicine, 76, 103–114. https://doi.org/10.1016/j.ypmed.2015.04.010
Pascal, M., Corso, M., Chanel, O., Declercq, C., Badaloni, C., Cesaroni, G., … Aphekom group. (2013). Assessing the public health impacts of urban air pollution in 25 European cities: results of the Aphekom project. The Science of the Total Environment, 449, 390–400. https://doi.org/10.1016/j.scitotenv.2013.01.077
qualitedelair.brussels. (n.d.). Qualité de l’air | Un site de Bruxelles Environnement. Retrieved February 7, 2017, from http://www.qualitedelair.brussels/
Sivaraman, V., Carrapetta, J., Hu, K., & Luxan, B. G. (2013). HazeWatch: A participatory sensor system for monitoring air pollution in Sydney. In Local Computer Networks Workshops (LCN Workshops), 2013 IEEE 38th Conference on (pp. 56–64). IEEE. Retrieved from http://ieeexplore.ieee.org/xpls/abs_all.jsp?arnumber=6758498
Strak, M., Boogaard, H., Meliefste, K., Oldenwening, M., Zuurbier, M., Brunekreef, B., & Hoek, G. (2010). Respiratory health effects of ultrafine and fine particle exposure in cyclists. Occupational and Environmental Medicine, 67(2), 118–124. https://doi.org/10.1136/oem.2009.046847
Theunis, J., Peters, J., & Elen, B. (2016). Participatory Air Quality Monitoring in Urban Environments: Reconciling Technological Challenges and Participation. In Participatory Sensing, Opinions and Collective Awareness (pp. 255–271). Springer. Retrieved from http://link.springer.com/chapter/10.1007/978-3-319-25658-0_13
UNEP. (2016). ABC for Sustainable Cities. (N. da Schio & S. Fryxell, Eds.). UNEP & FIDIC.
Whitehead, M. (2009). State, science and the skies: governmentalities of the British atmosphere. Chichester, U.K. ; Malden, MA: Wiley-Blackwell.
WHO. (2014, February 11). Burden of disease from Ambient Air Pollution for 2012 — Summary of results. WHO. Retrieved from http://www.who.int/phe/health_topics/outdoorair/databases/AAP_BoD_results_March2014.pdf
WHO. (2016, September). Ambient (outdoor) air quality and health – Fact sheet N°313. Retrieved May 26, 2017, from http://www.who.int/mediacentre/factsheets/fs313/en/
Zuurbier, M., Hoek, G., Oldenwening, M., Lenters, V., Meliefste, K., van den Hazel, P., & Brunekreef, B. (2010). Commuters’ Exposure to Particulate Matter Air Pollution Is Affected by Mode of Transport, Fuel Type, and Route. Environmental Health Perspectives, 118(6), 783–789. https://doi.org/10.1289/ehp.0901622
Annex. Limit values for selected pollutants & the Brussels context[2]
| Pollutant | WHO Guidelines [WHO, 2016] |
European Union Limit Values[3] [European Parliament & European Council, 2008] |
Situation in Brussels Capital Region in 2016 [irceline.be, n.d.] |
PM2.5 |
24-hour mean:
25 μg/m3 24-hour mean |
n/a | |
| Annual mean:
10 μg/m3 |
Annual mean:
25 µg/m3 |
In 2016, none of the stations recording PM2.5 in BCR exceeded the limit value (highest value was recorded by Avant-Port station, i.e. 17 μg/m3).
(Spatially averaged annual mean for Brussels Capital Region: 13.4 μg/m³) |
|
PM10 |
24-hour mean:
50 μg/m3 not to be exceeded more than 3 times a calendar year |
24-hour mean:
50 µg/m3 not to be exceeded more than 35 times a calendar year |
Number of days per year where the daily mean PM10 concentration (spatial average across BCR) exceeded 50 μg/m³: 7 times
In 2016, none of the stations recording PM10 in BCR exceeded the limit more than 35 days (max number of exceedance was recorded by Avant-Port stations, i.e. 15 times) |
| Annual mean:
20 μg/m3 |
Annual mean:
40 µg/m3 |
In 2016, none of the stations recording PM10 in BCR exceeded the EU limit value. Stations of Avant-port, Molenbeek-Saint-Jean and Neder-Over-Heembeek exceeded the WHO limit value, i.e. 25, 23 and 21 μg/m3)
(Spatially averaged annual mean for Brussels Capital Region: 18.3 μg/m3) |
|
Ozone (O3) |
8-hour mean:
100 μg/m3 |
Maximum daily 8-hour mean:
120 µg/m3 not to be exceeded more than 25 days per year, averaged over 3 years |
In Brussels, 8 stations measure O3 concentration.
In 2016, the maximum number of exceedances of the EU limit value is recorded by the Uccle and Berchem Sainte Agathe stations, with 9 exceedances. |
Nitrogen dioxide (NO2) |
1-hour mean:
200 μg/m3 |
1-hour mean:
200 µg/m3 not to be exceeded more than 18 times a calendar year |
In Belgium, this hourly limit value is easily attained. Very locally, in busy traffic streets, the 200 μg/m³ limit may be exceeded a few times per year, but the 18-timess limit is never reached in any of the monitoring stations. |
| Annual mean:
40 μg/m3 |
Annual mean:
40 µg/m3 |
Limit value exceeded in 2016, as recorded by the stations of Art Loi, Ixelles and Avant-Port, (i.e. 55, 51 and 41 µg/m3 respectively).
(Spatially averaged annual mean for Brussels Capital Region: 28.7 µg/m³) |
|
Sulphur dioxide (SO2) |
10 minutes mean:
500 μg/m3 |
n/a | |
| Hourly mean:
350 µg/m3 not to be exceeded more than 24 times a calendar year |
|||
| 24-hours mean:
20 μg/m3 |
24-hours mean:
125 µg/m3 not to be exceeded more than 3 times a calendar year |
[1] Describing in detail the situation in the Brussels Capital Region (BCR) is outside of the scope of this article: Brussels Environment and IRCELINE regularly publish data and reports on the pollution levels and on the different sources, which should be consulted for detailed and updated information. See, for instance, the BCR state of the environment (www.environnement.brussels/etat-de-lenvironnement) and (Bruxelles Environnement 2015a).
[2] The table indicates the limit values for the pollutants covered by the WHO guidelines (based on health standards) and the EU directive (legally binding in BCR). The limit values apply over differing averaging periods, given that the health impacts associated with the various pollutants can occur over different exposure times. The two sets of limit values are often different, with the latter being normally higher because of other than health considerations that were taken in setting them. In Belgium, the Interregional Environment Agency (IRCEL – CELINE), regularly publishes the results of the regional air quality measurements, which are reported in the column on the right.
[3] Red indicates that the EU limit value is less stringent than the WHO, yellow indicates the opposite
 NL
NL FR
FR